


A commercial HVAC system can look normal while its runtime, controls, airflow, or schedules quietly drive up energy use. Monthly utility bills show the financial result. They rarely show which equipment or operating condition caused it. Data logging and sub-metering add the time-based detail facility teams need to investigate.
Businesses can use data logging to track HVAC energy performance by recording system conditions over time, comparing those trends with utility bills, schedules, occupancy, and weather, then investigating unusual patterns. Sub-metering selected equipment or systems helps separate HVAC energy use from the rest of the building and supports a more useful baseline. DOE guidance notes that data-logging equipment or an energy management control system can record system data over time, while subsystem metering can support baseline and performance model calibration: DOE measurement and verification guidance.
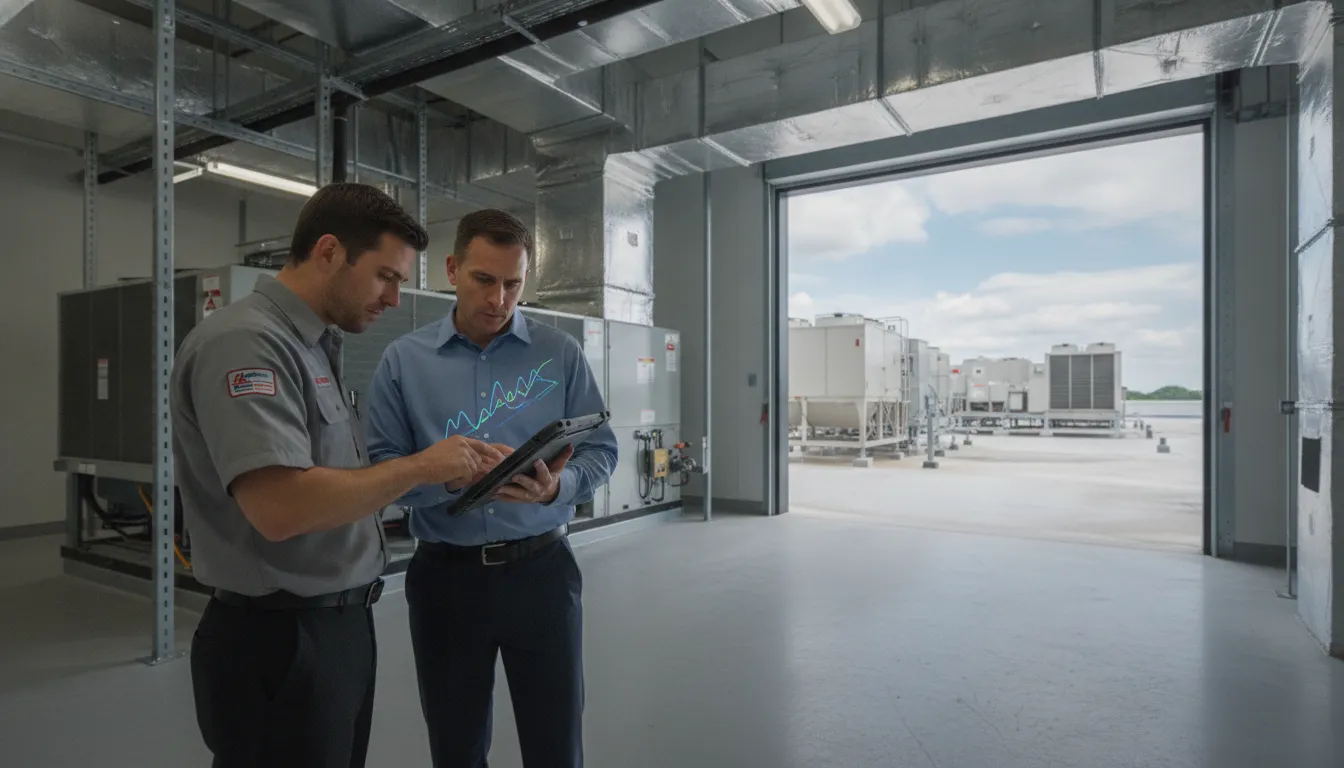
For a North Carolina office, restaurant, school, warehouse, or industrial facility, the process starts by defining what the existing meters can tell you. Then identify where finer measurements are needed. From there, the right data points can connect an unexpected energy trend to a specific operating decision.
How Can Businesses Use Data Logging to Track HVAC Energy Performance?
Answer: Businesses can use data logging to track HVAC energy performance by recording operating conditions over time. Comparing equipment or system data with whole-building utility use, and investigating trends before making maintenance, controls, or replacement decisions. The goal is not simply to collect readings. It is to connect measured conditions to how a North Carolina facility operates, including schedules, occupancy, weather, production, and comfort requirements.
Data logging is the time-based recording of measurements such as temperature, humidity, runtime, electrical demand, pressure, or airflow. A logger may capture conditions at regular intervals, while an existing building energy management control system can collect and store trend data from connected equipment. DOE guidance explains that an energy management control system or data-logging equipment can be set up to record system data over time. That record is more useful than a single visit because it can show when a condition occurs and whether it repeats.
Start with the right measurement boundary
Whole-building utility bills provide the broadest view. They may show electricity consumption, peak demand, meter dates, and other fuel use. But they do not identify which rooftop unit, air handler, chiller, or control sequence caused a change. Sub-metering narrows the view by measuring an individual piece of equipment, a system, or an end use. DOE notes that building subsystem metering supports calibration of an energy model during both baseline and performance periods. When an efficiency measure cannot be monitored directly, the affected HVAC system may be sub-metered instead.
Choose the boundary based on the business question. If a facility manager needs to understand the impact of a schedule change, system-level runtime and power data may be appropriate. If a multi-system building has an unexplained demand increase, separate measurements can help distinguish HVAC operation from other loads. Prioritize gaps where the existing utility data cannot explain what the equipment is doing.
Move from measurement to action
A practical measurement-to-action loop has four stages:
- Baseline: Record normal operation and document schedules, equipment, and relevant site conditions.
- Compare: Review logged trends alongside utility bills and operating context, rather than judging one isolated reading.
- Investigate: Check anomalies against setpoints, controls, airflow, equipment condition, and actual comfort or process needs.
- Act and verify: Adjust controls, schedule maintenance, or evaluate a larger repair or replacement decision, then continue monitoring to confirm the change behaves as intended.
DOE measurement and verification guidance supports more frequent monitoring because it can help confirm that systems operate as intended throughout the year and allow fine-tuning based on operational feedback. For commercial facilities across North Carolina, this approach turns data logging from a passive report into a repeatable operating practice.
Read the DOE measurement and verification guide for the underlying monitoring guidance.
What Should a Commercial HVAC Baseline Include?
A useful baseline is a documented picture of how a facility uses energy before changes are evaluated. It is not simply the last utility bill or a single temperature reading. The right scope depends on the building, operating schedule, HVAC configuration, and question being investigated. An office, restaurant, school, warehouse, and manufacturing plant may require different meters, time periods, and operating variables.
The baseline should connect energy use with the conditions that produced it. That gives a facility team a more credible reference for reviewing trends and investigating anomalies. It does not guarantee savings, because the result depends on equipment condition, controls, weather, occupancy, maintenance, and other factors.
- Set the baseline period and boundary. Collect at least 12 consecutive months of utility bills when feasible, with additional history preferred when reliable records exist. Define which building, meters, HVAC systems, and related loads are included. Record meter read dates, electric consumption in kilowatt-hours, peak electric demand, and heating fuel use such as natural gas. Some facilities or investigations may need hourly or 15-minute interval data. DOE measurement and verification guidance identifies these baseline requirements in its commercial measurement and verification guide.
- Document schedules and operating conditions. Record occupied and unoccupied hours, seasonal schedules, holiday exceptions, start-up and shutdown routines, and major process loads. Add weather context, including outdoor temperature trends when available, because heating and cooling demand changes with weather. Note occupancy, production, class schedules, kitchen activity, or storage requirements that could change the load from one period to another.
- Inventory the equipment and controls. Create a list of rooftop units, package units, split systems, air handlers, chillers, boilers, make-up air equipment, exhaust systems, pumps, and other relevant equipment. Record capacity, model and serial information, age, condition, and operating schedule. Include fan and motor details, airflow and static-pressure information, economizer operation, zones, temperature setpoints, control setpoints, schedules, and special sequences. These details help explain why two similar buildings may show different energy patterns.
- Choose measurements that answer the question. Whole-building bills may reveal a trend, while equipment-level or system-level sub-metering can show where energy is being used. DOE guidance notes that subsystem metering can support calibration of a baseline and performance model, and that monitoring should address installed measures, related systems, or important data gaps. When an efficiency measure cannot be monitored directly, the affected HVAC system may need sub-metering. Keep data logging to track HVAC energy performance tied to the defined boundary, then compare readings with schedules, weather, occupancy, and equipment operation.
Once assembled, the baseline becomes a reference for review rather than a promise of a particular outcome. A qualified commercial HVAC team can help determine whether gaps point to a control issue, airflow problem, maintenance need, or a more complex equipment investigation.
Which HVAC Data Points Help Reveal Hidden Inefficiency?
Answer: The most useful HVAC data points are temperature, humidity, runtime, current draw, airflow, static pressure, setpoints, schedules, economizer operation, ventilation, and control signals. Logged over time, they show when a system works harder than expected or operates outside the building’s actual needs. They do not, by themselves, prove the mechanical cause. A qualified HVAC professional must validate unusual readings and diagnose equipment, ductwork, electrical, and control issues.
A short site visit can miss a pattern that appears only during a morning warm-up, an occupied afternoon, a mild-weather day, or an overnight schedule. Data logging to track HVAC energy performance creates a time-based record that can be compared with occupancy, weather, operating hours, and utility data. DOE guidance specifically identifies data logging equipment or an energy management control system as tools for recording system data over time. DOE measurement and verification guidance also calls for reviewing equipment characteristics, operating schedules, airflow, static pressure, economizer operation, and controls.
Look for comfort and load signals
Temperature and humidity trends can reveal zones that drift from their intended conditions, recover slowly, or call for heating and cooling at the same time. Outdoor conditions provide essential context. A return-air or supply-air temperature pattern may suggest a load, sensor, damper, or sequence issue, but the trend is a clue rather than a diagnosis. Humidity is equally important in North Carolina facilities because a space can reach its temperature setpoint while still experiencing moisture-related comfort or process concerns.
Runtime and current draw add another view. Excessive runtime during mild conditions may point to incorrect schedules, inadequate airflow, leakage, controls problems, or equipment capacity concerns. Current-draw trends can help flag a motor or compressor operating abnormally. One competitor source describes runtime and current monitoring as a way to identify possible compressor issues. But that general concept should be treated as a screening signal, not proof of a failed component. Electrical measurements and equipment diagnosis require appropriate qualifications and safe procedures.
Check airflow, pressure, ventilation, and controls
Airflow and static pressure readings help explain why a unit may run longer without delivering expected conditions. Restricted filters, coils, dampers, ducts, or terminal devices can change pressure and reduce delivered airflow. Ventilation deserves specific attention because DOE notes that ventilation airflow rates can have a substantial effect on energy use. Log economizer position, outdoor-air conditions, ventilation operation, and associated control commands rather than assuming the damper sequence is working as designed.
- Compare zone temperatures and humidity with setpoints and schedules.
- Trend runtime and current draw against outdoor temperature and occupancy.
- Review supply airflow, static pressure, economizer position, and ventilation status.
- Flag conflicting commands, excessive overrides, and controls that do not match the intended sequence.
Logging shows when and under what conditions an anomaly occurs. Diagnosis determines why it occurs and what response is appropriate. Review the trends with the equipment inventory, control sequence, and operating history before changing settings. More frequent monitoring can help confirm that systems operate as intended and support fine-tuning based on operational feedback, according to DOE guidance. For commercial facilities, this measured approach helps separate a scheduling problem from an airflow restriction, sensor error, controls fault, or developing equipment issue.
How Do Sub-Meters Turn Building Data Into Useful KPIs?
A whole-building utility bill tells you how much energy the property used during a billing period. It does not show which air-handling unit, chiller, rooftop unit, or operating condition drove that total. Sub-meters narrow the system boundary, allowing facility teams to compare an HVAC system or end use with the building’s broader performance. DOE measurement and verification guidance notes that subsystem metering can support calibration of an energy model during both baseline and performance periods, especially where existing information is limited. Read the DOE guidance.
That distinction matters when using data logging to track HVAC energy performance. Start with a defined baseline period and preserve the same comparison boundary during the performance period. Whole-building bills may provide meter dates, kilowatt-hours (kWh), peak electric demand, and heating fuel use. Depending on the question, hourly or 15-minute interval data may also be needed. The result is not automatically a savings claim. It is a clearer record for asking what changed, when it changed, and whether equipment operation matches the building’s schedule.
| Data source | Question answered | Limitation |
|---|---|---|
| Whole-building utility bills | How did total kWh, peak demand, or fuel use change across the baseline and performance periods? | They combine HVAC with lighting, plug loads, process equipment, refrigeration, and other uses. |
| Equipment or system sub-meter | What is the electrical demand or energy pattern for a defined HVAC system or end use? | It requires a suitable meter, a clear system boundary, and interpretation alongside schedules and operating conditions. |
| Occupancy or production records paired with energy data | Does energy use move with occupied hours, output, throughput, or another operating measure? | The comparison depends on reliable operational records and may not explain the cause of an unusual result. |
| Chiller performance points | What do chilled-water supply temperature, return temperature, and flow show about the water-side operating pattern? | These points describe part of the system and should be reviewed with controls, load, equipment condition, and other relevant measurements. |
For a manufacturing or distribution facility, a KPI may relate HVAC or plant energy data to occupancy, production, or another operating measure. Production data can be correlated with energy monitoring to create an energy-intensity KPI, such as energy per unit of output, when records and boundaries are appropriate. The metric should be defined for that facility, not treated as a universal threshold. A production KPI can also establish a baseline for comparison with later operation or optimization scenarios. The KPI and production-data discussion provides this framework.
In a chilled-water plant, looking only at chiller kW can conceal context. Chilled-water supply temperature, return temperature, and flow may show how the plant responds to load and whether the pattern warrants investigation. Component-level KPIs can be organized into system-level views, while dashboards place trends beside occupancy, production, schedules, and weather. The dashboard is the display, not the diagnosis. A qualified HVAC professional still needs to validate sensor quality, control sequences, airflow, and equipment condition before a KPI becomes a maintenance, controls, or replacement decision.
How Can Facility Teams Turn HVAC Trends Into Action?
Answer: Use trend data as a decision signal, not a diagnosis. Validate an unusual pattern against schedules, weather, occupancy, and recent operating changes. Then inspect controls and equipment, assign the right corrective action, and continue monitoring to confirm that the system is operating as intended.
A practical review starts with the anomaly itself. A sudden increase in runtime, demand, or temperature drift may reflect a real equipment problem. But it may also follow an extended operating schedule, an unusually hot day, a production change, or a temporary occupancy increase. Compare the trend with weather and building schedules before dispatching a repair. This simple check helps separate a fault from a legitimate change in load.
Next, review the control context. Check setpoints, occupied and unoccupied schedules, start and stop times, alarms, and the sequence controlling the affected equipment. For facilities with a building automation system (BAS), bring related data streams into the same review when possible. A 2022 Department of Energy and National Renewable Energy Laboratory (NREL) field validation report describes an energy management information system that connected to BAS data. The system combined historical information with occupancy and weather factors and supported visualization and operational analysis. That report evaluated a specific study platform, not a QRC product or offering. Its broader lesson is that context makes trend data more useful than an isolated chart.
Use the findings to create a prioritized action list. A schedule correction or setpoint adjustment may be appropriate when controls are causing unnecessary operation. A maintenance inspection is more appropriate when trends coincide with airflow changes, repeated alarms, unstable temperatures, or equipment cycling. DOE guidance notes that more frequent monitoring can verify operation throughout the year and allow teams to fine-tune measures using operational feedback. Document the change, its date, and the trend that should improve afterward.
Some patterns warrant a deeper decision. Persistent performance deterioration, capacity limitations, or recurring failures may justify commissioning, a repair assessment, or a replacement study rather than another isolated adjustment. A facility with chillers can also review operating data alongside chiller warning signs for facilities before a reliability issue becomes disruptive. For rooftop units, packaged systems, make-up air, or DDC controls, a qualified team can connect the logged pattern to field conditions and maintenance history through commercial HVAC services.
Finally, make the review recurring. Record the baseline, action taken, responsible person, and follow-up date. QRC supports commercial HVAC audits, optimization, preventive maintenance, BAS, and DDC controls for businesses across North Carolina. Those capabilities can help facility teams move from data logging to track HVAC energy performance toward informed maintenance and capital planning. Do not treat every unusual trend as proof that replacement is necessary.
When Should a North Carolina Business Bring In a Commercial HVAC Professional?
Bring in a commercial HVAC professional when trend data is difficult to interpret. Comfort or production conditions are at risk, or the suspected cause involves airflow, controls, equipment condition, or safety. Data logging to track HVAC energy performance can show when a system behaves differently. It does not by itself explain whether the cause is a failed sensor, restricted airflow, an incorrect schedule, or a mechanical fault.
A professional review is especially useful when the data conflicts with what occupants or operators are experiencing. Rising runtime may reflect weather, occupancy, ventilation requirements, a drifting setpoint, or declining equipment performance. A qualified technician can compare the logged trend with the equipment inventory, operating schedule, zone conditions, and physical readings. A DOE measurement and verification guide recommends reviewing items such as fan operation, airflow. Static pressure, economizer performance, and controls, because each can affect how a system uses energy. DOE measurement and verification guidance provides the underlying framework.
Situations that call for expert review
- Comfort or process limits are being missed. Persistent hot or cold zones, humidity problems, inadequate ventilation, or temperature instability can affect employees, customers, inventory, manufacturing, healthcare, and other sensitive operations.
- Controls data does not make sense. Conflicting schedules, setpoints, alarms, occupancy responses, or direct digital controls (DDC) trends may require a controls review rather than another round of guesswork.
- Airflow or equipment problems are suspected. Unusual runtime, pressure changes, short cycling, uneven temperatures, or rising demand can justify inspection of filters, fans, dampers, coils, motors, economizers, and major equipment.
- Safety or reliability is involved. Refrigerant concerns, combustion equipment, electrical hazards, water leaks, repeated shutdowns, or emergency conditions should not be diagnosed from trend data alone.
- A major decision is approaching. Before commissioning, replacing, or materially changing a rooftop unit, air handler, chiller, or building automation sequence, professional verification can help define the actual problem and the appropriate scope.
For a large campus, manufacturing site, distribution center, or other complex property, industrial HVAC services for facilities may be the appropriate starting point. The goal is not simply to collect more data. It is to connect credible measurements with safe maintenance, controls adjustments, commissioning, or replacement planning.
Discuss your commercial HVAC performance questions with QRC at (336) 281-5144
Frequently Asked Questions
Can a data logger measure HVAC energy consumption?
It can record selected operating data over time, but the measurement depends on the logger and sensors used. Electrical sub-meters can capture equipment or system energy use, while other inputs may track temperature, humidity, runtime, airflow, or pressure. Whole-building utility bills provide the larger energy picture. Comparing both levels helps separate HVAC consumption from other facility loads.
What should a commercial HVAC data logger measure?
Start with the question you need to answer. Useful points may include supply and return temperatures, humidity, runtime, current, airflow, static pressure, setpoints, schedules, economizer operation, and ventilation. The right selection depends on the equipment, controls, comfort requirements, and suspected issue. A logger shows patterns, but a qualified professional must interpret whether a pattern indicates a control, airflow, maintenance, or equipment problem.
How long should a business collect HVAC performance data?
Short-term logging can reveal operating patterns, but the collection period should cover the conditions relevant to the decision. For baseline work, the U.S. Department of Energy recommends at least 12 consecutive months of utility bills, with longer histories preferred when available: DOE measurement and verification guidance. Hourly or 15-minute data may be needed for some analyses.
When is sub-metering better than whole-building utility data?
Sub-metering is useful when whole-building bills cannot show which systems drive consumption. A meter on an affected HVAC system or major subsystem can support comparison with schedules, weather, occupancy, or production. It is especially valuable when an efficiency measure cannot be monitored directly. The boundary should be defined before installation so the data answers a specific operating or investment question.
Who should interpret HVAC logging results?
Facility staff can review trends and flag unusual runtime, temperatures, demand, or simultaneous heating and cooling. A commercial HVAC professional should investigate findings that involve controls, airflow, ventilation, refrigerant circuits, electrical loads, or equipment condition. That review connects the data to safe corrective work instead of treating every unusual graph as proof of an energy fault.
Ready to Measure and Improve Commercial HVAC Performance?
Clear trend data can help your team connect HVAC operation with comfort, maintenance planning, and building performance. Talk with QRC about commercial HVAC energy monitoring, controls, maintenance, or optimization, or call (336) 281-5144 to discuss the conditions and equipment in your North Carolina facility.